Twitter analytics is not just the likes on your tweets! It is the best place to learn how your business is performing on the platform through its content performance and audience engagement.
Twitter analytics measure different metrics and help you understand where your content needs improvement by delivering you data on your tweet performance, audience demographics, likes, impressions, engagement rate, retweets, and a lot more.
Using analytics, you can create data-driven conclusions about your social media strategy, with which you can optimize your Twitter drives to get better outcomes & more followers without assuming your plan will work or not.
3 Main Benefits of Twitter analytics-
- Learning About Audience’s Preferences
You’ll discover helpful audience insights around what your followers react to the most. Is it a text post? Images? Video? Polls? Cat GIFs?
Learning about this data is critical to understand the style of content that is running or missing the mark.
Also, it lets you know days of engagement, largely Sundays or some other time of the day.
- Tracking Your Growth
X Analytics data lets you track follower gain or loss per month and see growth trends over time.
- Figuring Out the Best Time For Posting
The truth is that there’s no ideal time for everyone because of niche segment divergences and time zone suitability.
It totally depends on the audience preferences & numerous time zones.
With the Twitter analytics page, you can tell the best practices of posting, time of the day, and most engagement on your Tweets.
How to View Twitter Analytics

Whether you are a brand or individual tweeting for joy, you will get access to the native Twitter analytics dashboard ( it is free for all, no requirement for an account to be a business or professional page)
Twitter insights on the native Twitter analytics dashboard are uncomplicated to gain access to.
Let’s check-
Step 1- Log in to your Twitter account
Step 2- Scroll to the left menu bar, click More at the bottom
Step 3- Another menu bar will pop up, click Analytics
After entering the dashboard, you will witness the Twitter metrics for your account.
Let us understand each metric to make sense of the dashboard-
- Tweets – The total number of posts you have published (tweeted) on Twitter
- Tweet Impressions – The number of times users saw your tweet on Twitter.
- Profile Visits – The total number of users visiting your Twitter profile. Twitter Analytics won’t calculate your visits to your profile and won’t include multiple visits from the same user.
- Mentions – Total number of times your @brand handle was tagged in a tweet
- Followers – Total number of users following your @brand handle on Twitter.
- Top Tweet – The tweet that received the highest number of impressions over time.
- Top Mention – Any tweet that mentioned your @brand handle and received the highest number of impressions (This does not have to be someone who follows your handle)
- New Followers – Number of new Twitter followers you gain over time.
- Retweets – Total number of times a tweet was retweeted/ re-posted.
- Likes – Total number of likes received on your Tweets.
- Replies – Total number of comments received on your tweets.
- Link Clicks – Total number of times a link was clicked in a tweet.
- Promoted – Tweets you used as an ad to reach a wider group of followers
- Engagements – This is the total number of times a user has interacted with a Tweet. This includes all clicks anywhere on the Tweet (hashtags, avatar, links, username, Tweet expansion), retweets, clicks, follows and likes.
- Engagement Rate – The number of Engagements (clicks, retweets, replies, follows and likes) divided by the total number of Impressions.
Importance of Twitter Analytics
 Twitter allows brands to utilize it for paid promotions, so it is essential to keep a check on Twitter analytics.
Let’s check what Twitter promotions have to offer-
- Promoted Accounts
With Promoted Accounts, you can boost your Twitter handle even to those users who are not following you. Such promotions allow you to spread your reach to wide customers.
These types of campaigns are called the Followers campaign.
- Promoted Trends
With Promoted Trends, you can promote your brand, topic, or hashtag for 24 hours alongside the Trends list.
- Promoted Tweets
Promoted Tweets let you push ordinary Tweets as an ad to a broader audience to expand engagement from their followers.
- Promoted-only Tweets
Promoted-only Tweets are ad campaigns especially targeted to a custom set of audiences.
- Promoted Video
Brands can push a Video Tweet as Promoted Videos for their ad drives by clearly mentioning them as “Promoted” content.
They can appear on your timeline, trends list, search results, or some other place on the platform.
What are the Key Metrics to Track with Twitter Analytics

1. Top Tweet
Track your top tweets to understand which tweets are doing exemplary so that you can boost that Tweet and spend money where it matters. ( on posts with the best-performing content)
Also, tracking the top Tweet with the maximum engagement/ impressions will let you know if there is a trend behind good-performing posts.
This metric allows you to assess appropriate content as per your slot audience.
2. Tweets

On the homepage of your Twitter analytics dashboard, you can notice how many tweets you have published in a month to keep track of all the daily/ monthly publishing targets.
3. Followers
Twitter analytics permits you to track the number of followers acquired or lost over a while, along with the current follower count.
Tracking follower count is great, but it is best to track the metrics that impact business growth, such as post engagements and clicks.
If you have a bigger follower count yet low engagement & interactions on your posts, it doesn’t do any good for your business
4. Profile Visits
Also, analytics Twitter provides you data about the number of profile visits on your account over some time.
It tells you about the number of people visiting your Twitter profile and feed.
Tracking this metric will let you know the kind of steps visitors make on the account.
5. Top Follower
This metric lets you learn about the most significant number of followers that followed you in a month.
Tracking this metric will let you know about your new followers with high reach and influencing possibilities.
You can utilize this metric to thank new followers with a mention in your posts.
6. Top Mentions
This metric informs you about the tweets that mention your Twitter account and have acquired the highest engagements.
By tracking this metric, you can engage with your best-performing Tweet.
Engaging with such tweets (irrespective of negative or positive) will grow your brand’s visibility among that account’s followers.
7. Impressions
The impressions metric is a mode to gauge your reach and the style of content grasping the audience’s engagement.
It is an essential metric to track to determine the number of times your Tweet has been seen by users organically over a certain period on Twitter. (including retweets and quotes tweets)
You can measure the impression at the account level and specific Tweet level.
However, you can’t measure the number of unique accounts that saw your Tweet.
This metric conveys brand awareness by informing the number of tweets that have reached multiple feeds.
8. Hashtag Analytics

Twitter Hashtag analytics lets you estimate the number of views your Tweet received.
Play around with Hashtags, as they can be a primary factor for getting solid impressions, and track the metrics to know which hashtag performs best for your niche segment.
9. Engagements
This metric measures the number of interactions on a Tweet, including ways of interactions, such as likes, media expands, replies follows from a Tweet, retweet, link clicks, etc.
It is to gauge your performance against community engagement and brand engagement purposes. Also, it tracks the number of views at the account level and individual Tweets.
10. Link Click
Link Click measures the numbers people have clicked on a link inside your Tweet. ( measure at the tweet level and overall account level)
It helps you track the engagement level of the links you post.
11. Engagement Rate

This metric helps analyze how your Twitter account performs overall rather than only determining engagement or impressions.
It is the rate at which your audience is interacting with your tweets.
Engagement rate is determined by dividing your total Twitter engagements by total impressions.
While a higher engagement rate indicates the Tweet prompted a conversation, a low engagement rate does not imply that the tweet performed poorly.
This metric(twitter analytics) plays a crucial role in pushing traffic to your website directly from Twitter.
If it has profound impressions and a low engagement rate, the content is worth sharing and doesn’t require anyone to comment on it.
You can study the tweets with the highest engagement rates and review the reasons for success, such as hashtags, video, caption, question, etc.
12. Cost Per Result (CPR)
This metric is valuable when you have availed of Twitter advertising.
Whenever you are running an ad on Twitter, it is necessary to analyze key metrics that outline its success.
It defines the average cost of every action a user takes on your Twitter ads. You can also follow metrics like impressions, engagement rate, results, etc., for your ad campaign.
Twitter analytics dashboard delivers all the vital information but not in-depth insights to help you accomplish your targets. Choose expert Twitter analytics tools like Socinator to provide a much-needed stimulus to your Twitter business account right now.
Socinator

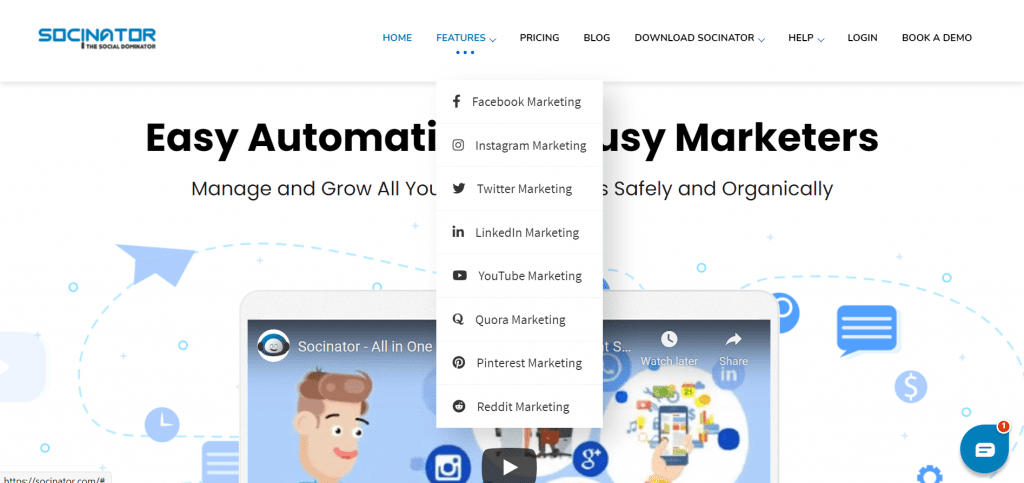
Socinator is an easy automation tool for busy marketers that effortlessly handles consistent social media posting needs with easy marketing solutions for Facebook, Instagram, Twitter, LinkedIn, Quora, YouTube, Pinterest, and Reddit.
With Socinator, you get easy automation across multiple social media management platforms like- Facebook automation, Instagram automation, Twitter automation, Quora automation, Pinterest automation, LinkedIn automation, Reddit automation, YouTube automation, and Tumblr automation.
Let us discuss about Twitter-
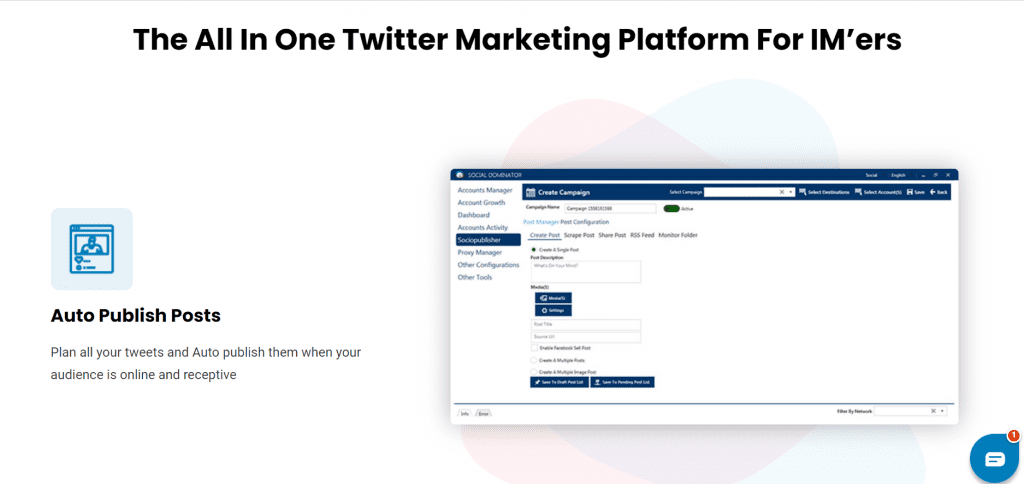
Twitter Automation
Boost your activities on Twitter for better engagement and ROI. Auto Follow, Follow Back, Auto Like, Auto Comment, Auto Retweet, Auto Messages, Live Chat and Many More
Twitter Marketing Speciality Features-
- Activity statistics and Reports
- Auto Comment
- Auto Follow
- Auto Follow Back
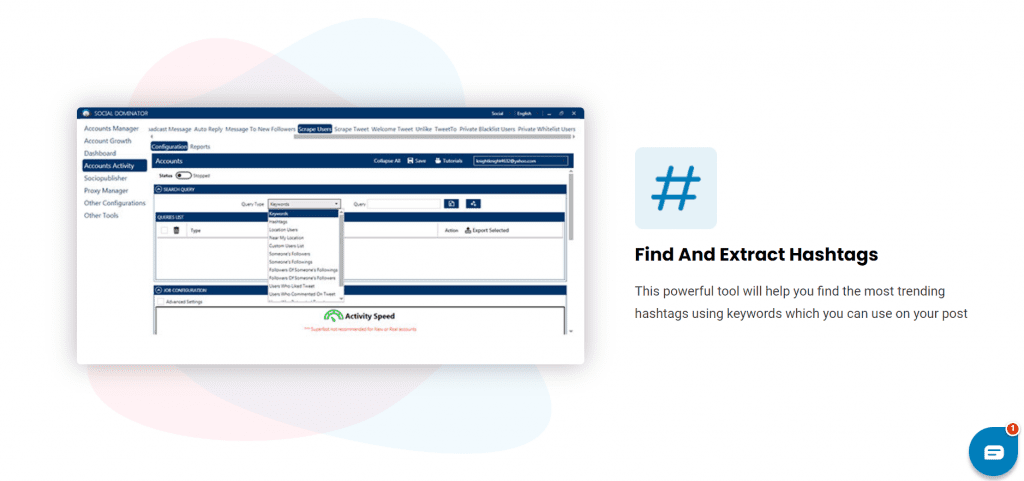
- Find and extract trending Hashtags
- Auto Like/ Favourite
- Auto reply messages
- Auto ReTweet
- Broadcast messages
- Efficient Account Management
- Full account and report export
- Tweet from RSS
- Mention Users
- Monitor folder features
- Proxy support
- Schedule profile picture change
- Spintax support
- Unlike
- Message to new followers
- Scrape user
- Scrape Tweet
- Auto Repost
- Welcome Tweet
- TweetTo
- Delete
- Mute
- Unfollow
It enables you to visualize your entire marketing plan for Twitter posting and lets you effortlessly find and extract trending hashtags well in advance to boost your marketing game.
Socinator is also packed with some more amazing features like:
- Auto publish posts from RS,
- Auto shorten URLs
- Auto Submit captcha verification
- Detailed report for each and every activity
- Embedded browser for each network
- Analytics and Growth Metrics.
Twitter’s native analytics is an ideal place to collect data, but Socinator’s Twitter analytics presents a deep understanding of your Twitter profile and helps you expand your business.
Also, it is a one stop destination for all the essential insights on other social networks.
Also Read-
Why Tools for Social Media Management
To Sum Up
Analytics allows you to thrive in the rapidly evolving social media topography.
By tracking the Twitter metrics, you can swiftly acclimate to the customer’s growing needs and level up your game with a bang.
When you leverage rightly, it can turn into a valuable asset.


