Data is the new oil. But not all data fuels growth. Marketing agencies juggle endless numbers—likes, shares, impressions—but do they truly measure success? That’s where X analytics makes the difference. It cuts through the noise, highlighting the metrics that impact ROI.
The challenge? Many marketers still focus on vanity metrics that look good but don’t drive revenue. If you want to scale campaigns, you need data that matters.
In this blog, we will walk you through seven key Twitter analytics metrics every agency must track in 2025. These insights will help you optimize performance, improve conversions, and stay ahead in the fast-changing digital landscape. Let’s get started!
In a hurry? Listen to the blog instead!
What Does X Analytics Mean?
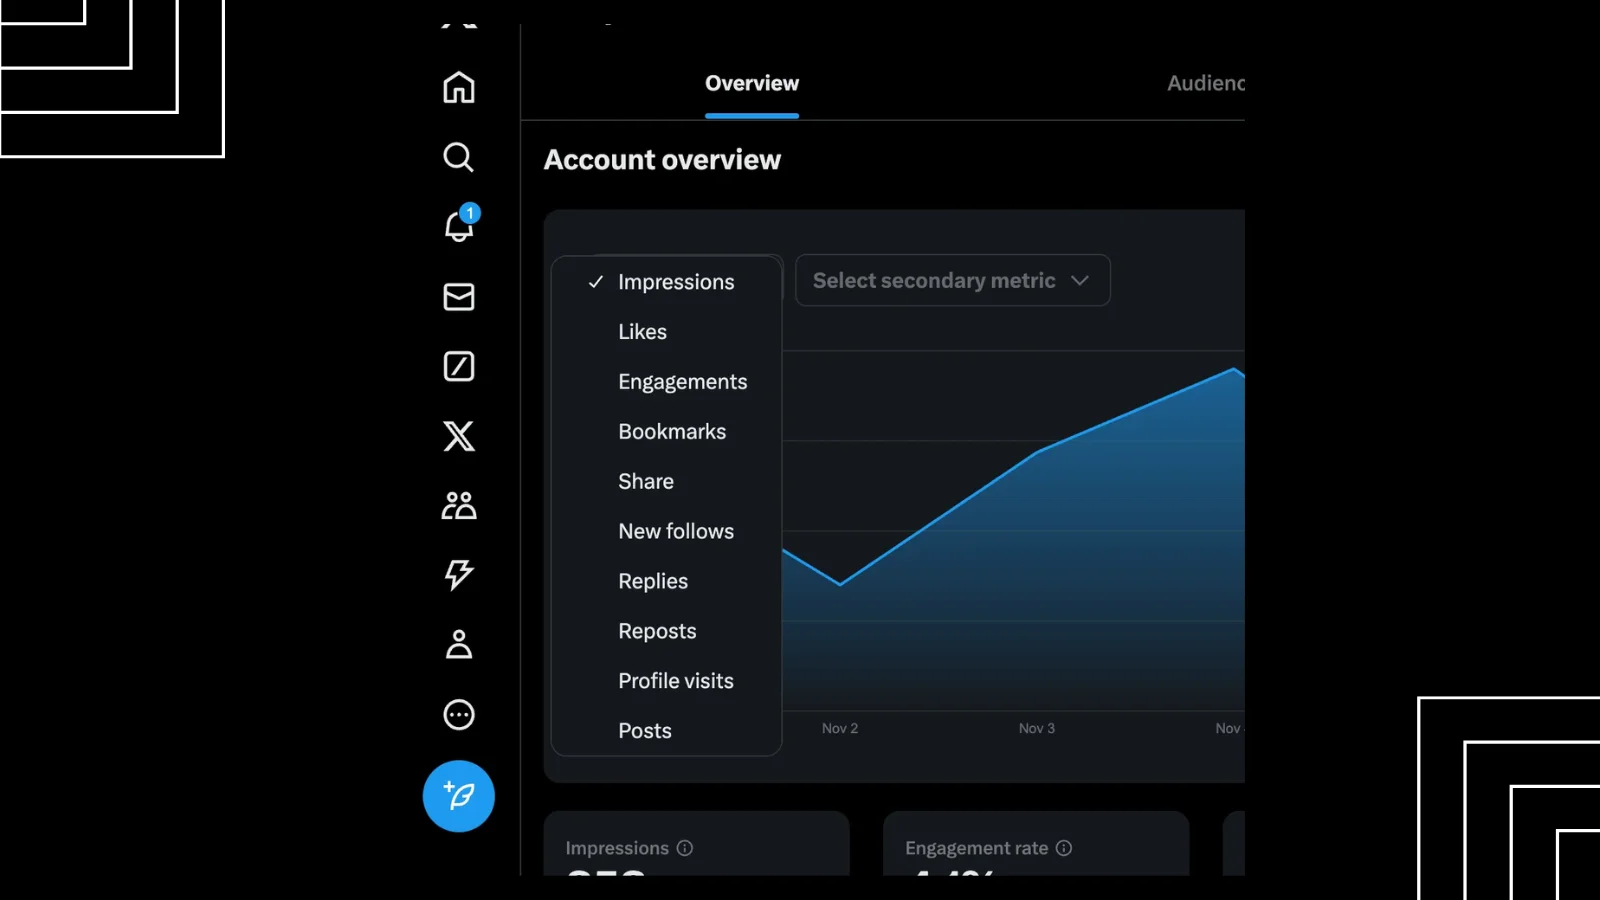 X analytics refers to the key performance metrics that help you measure your posts’ reach and audience engagement. It tracks essential data points like follower growth, impressions, engagement rates, reposts, and replies. Your native Twitter analytics dashboard provides these insights in real-time.
Tracking this data helps you understand who interacts with your content and how your account performs. Checking your posts daily gives a general idea, but data-driven insights confirm what’s working. By analyzing these metrics, you can adjust your strategy for better results.
Why does this matter? Because guessing isn’t enough. Even if you check your posts daily, accurate data helps confirm what’s working and what’s not. With these insights, you can refine your strategy to maximize results.
For deeper analysis, Twitter automation software like Socinator can streamline reporting and improve engagement. Leverage analytics to track trends, optimize content, and grow your audience effectively.
Who Should Use X Analytics?
Anyone who desires to track their X (Twitter) account performance should use analytics. Creators, marketers, agencies, and businesses can all benefit from these insights. If your goals depend on key performance indicators (KPIs), analytics help you make data-driven decisions analytics reveal what type of content engages your audience the most. No matter your industry or role, these insights refine your marketing strategies for better results.
Twitter Analytics for Social Media Practitioners
If you manage an X (Twitter) account, analytics help you measure post-performance. You can track engagement metrics and identify top-performing content. It allows you to optimize your strategy and align your posts with audience preferences.
X Analytics For Marketing Leaders
As a marketing leader, focus on customer engagement, conversions, and brand growth. Analytics help you track link clicks, conversions, and audience behavior. While direct purchases aren’t possible on X (Twitter), you can monitor how posts drive traffic to your website.
These insights also show the impact of paid and organic strategies. By reviewing key metrics, you can measure your social media return on investment (ROI) and adjust campaigns for maximum results.
Why Analytics Matter?
Understanding your performance helps you refine your approach. Twitter audience analytics provide a full engagement picture, allowing you to improve your content, increase brand awareness, and grow your reach effectively.
7 Important X Analytics Metrics For Marketing Agencies In 2025
 In today’s fast-paced digital world, marketing agencies rely heavily on analytics to track performance, optimize strategies, and deliver measurable results for clients. Big numbers might look impressive, but key metrics show how your audience reacts and how well your campaign works.
If you want to drive engagement, increase brand awareness, and refine your Twitter marketing strategy, here are seven crucial analytics metrics to monitor in 2025:
1. Impressions – The Foundation of Visibility
Impressions indicate how often a post appears on users’ screens. This metric shows how many people might see your content—the more impressions, the more visibility. But impressions alone don’t guarantee success. However, impressions alone don’t determine success.
If users see a post multiple times, each view counts as a separate impression, making it crucial to evaluate other engagement metrics alongside it.
2. Reach – Identifying Your True Audience Size
While impressions count every instance of a displayed post, reach measures the number of unique users who see it. It helps agencies understand how far their content is spreading. Since X does not provide direct reach data, you can use an estimated formula:
Estimated Reach = (Impressions / Followers) x 100
For instance, if a tweet garners 1,000 impressions and an account has 10,000 followers, the estimated reach is 10%. Tracking reach enables agencies to assess content visibility and improve audience targeting strategies.
3. Engagement Rate – Measuring Content Effectiveness
 Engagement rate is a critical metric that measures interactions such as likes, reposts, replies, and clicks. A high engagement rate indicates that the content is resonating with the audience. The formula to calculate the engagement rate is:
Engagement Rate = (Total Engagements / Total Impressions) x 100
A strong engagement rate falls between 0.02% and 0.09%, with high-performing posts exceeding 0.33% for marketing agencies. Analyzing engagement trends allows agencies to refine Twitter marketing strategies for better audience interaction.
4. Follower Growth – Expanding Brand Influence
Follower count alone doesn’t define success, but tracking follower growth over time helps agencies understand the effectiveness of their content and outreach efforts. A consistent increase in followers indicates that you are attracting and retaining the right audience.
Using Twitter analytics tools, agencies can analyze spikes in follower growth and adjust strategies accordingly. If growth stagnates, experimenting with different content formats, posting frequencies, and engagement tactics can help reignite momentum.
5. Video Completion Rate – Evaluating Video Impact
With the rise of video content, video completion rate has become a key metric in X analytics. It measures the percentage of viewers who watch a video from start to finish. A high completion rate suggests strong engagement, while a low rate may indicate:
- The video is too long
- The content isn’t engaging enough
- The message isn’t clear
Aim for a 60%+ completion rate for videos under 30 seconds. For longer videos, a 50%+ completion rate is considered functional. Agencies should optimize video content based on completion trends to enhance engagement.
6. Hashtag Performance – Boosting Discoverability
Hashtags play a crucial role in increasing the visibility of tweets. However, not all hashtags generate the same level of engagement. Tracking hashtag performance helps agencies determine which hashtags drive the most impressions and interactions.
Since X’s native analytics provide limited hashtag data, third-party Twitter analytics tools like Socinator can offer deeper insights. Leveraging trending and niche hashtag combinations can enhance discoverability and engagement.
Socinator- Advanced Social Media Marketing & Automation Tool
 Socinator is a powerful social media automation tool that helps you streamline your marketing efforts and enhance audience engagement. It automates routine tasks, saves time, and optimizes your overall strategy. Here are its key features:
1. Auto Publish Posts
Schedule and automate your content to maintain a consistent online presence without manual effort.
2. Performance & Activity Reports
Track engagement, monitor performance, and gain insights to refine your strategy with detailed analytics.
3. Auto Follow/Unfollow
Expand your reach by automatically following relevant users and keeping an optimized audience list.
4. Auto Comment & Follow Back
Engage with your audience effortlessly by automating replies and following back your supporters.
5. Auto Like & Unlike
Interact with relevant content by automatically liking or unliking posts to maintain a balanced feed.
6. Auto Reply Messages
Send instant responses to messages, ensuring timely engagement and stronger connections.
7. Auto Retweet & Repost
Reshare valuable content and keep your account active with automated retweets and reposts.
8. Extract Engaged Users & Hashtags
Identify active users and trending hashtags to refine your targeting and improve visibility.
Socinator simplifies social media management, making it easier to grow your brand, engage with your audience, and achieve better marketing results.
7. Click-Through Rate (CTR) – Measuring Audience Interest
CTR indicates the percentage of users who click on links within a post. It is a crucial metric for agencies running campaigns with website links, product promotions, or landing pages.
CTR = (Total Clicks / Total Impressions) x 100
A higher CTR signifies that the content is compelling enough to drive action. To improve CTR, agencies should focus on clear CTAs, compelling visuals, and relevant content encouraging your users to take the next step.
Optimize Your X Strategy with Data-Driven Decisions
Marketing agencies must harness X analytics to make informed decisions, improve content strategies, and maximize engagement. Tracking these essential metrics ensures that efforts align with audience preferences and business goals.
By leveraging advanced Twitter analytics tools, agencies can gain deeper insights into performance trends and create data-driven strategies that deliver measurable success in 2025.
How To Read Your X Analytics To Grow Smart?
Understanding your data and x algorithm is key to improving your Twitter strategy. It’s not just about collecting numbers—it’s about using them to make smarter decisions. X analytics provides insights into your posts, audience engagement, and overall performance. Here’s how to analyze and act on this data effectively.
- Connect Impressions with Engagement
If your posts get many impressions but little engagement, something is missing.
Example: A post with a high impressions rate but few likes or shares means people see it but don’t find it compelling. Enhance your call-to-action or change the post format to encourage interaction.
- Measure The Quality of Engagement
Numbers alone don’t tell the whole story. Look at the type of engagement you receive.
Example: If a post gets many replies but few likes, it indicates people are interested but might not fully agree. Check the replies’ sentiment and adjust your content to encourage a more balanced response.
- Think Like Your Audience
See your posts from your audience’s perspective. Are they relatable and shareable?
Example: If an industry insight post gets some likes but no shares, the tone may not encourage sharing. Make the content more neutral and idea-focused rather than personal to increase shareability.
- Learn from Your Best Posts
Use X analytics to find high-engagement posts, such as shares, replies, or profile clicks.
Example: Compare top-performing posts and identify patterns. Was it the timing, topic, or tone that worked? Apply those insights to future content.
- Create a Story from Your Data
Instead of looking at metrics separately, find a pattern that explains audience behavior.
Example: If a post has many likes but few shares, people agree with it but don’t want to share it. Add a broader appeal or discussion element to encourage more sharing.
Refine your content strategy and improve engagement by analyzing Twitter follower analytics and X analytics regularly. The goal is to make data-driven decisions that help you grow.
Read More
How To Master The X Algorithm In 2025?
How X Analytics Drives Business Results?
 X analytics helps businesses make quick-witted decisions that improve performance and boost revenue. Companies improve their strategies and get better results if they study audience behavior and content engagement.
Understand Your Target Audience
X analytics provides a clear view of your audience. For example, a retail brand may find that most engaged followers are young adults aged 18-25. The brand can increase engagement and drive more sales by creating appealing and engaging content for this group. Tools like Socinator help automate and optimize social media strategies, ensuring the right content reaches the right audience effortlessly.
Optimize Content Strategy
Tracking performance metrics helps businesses identify what works. A tech company posting blog links, infographics, and videos may discover that infographics get the most shares and clicks. This insight allows them to focus on content that resonates best with their audience.
Measure Campaign Performance
X analytics helps businesses track marketing campaign success in real-time. For instance, a food delivery service promoting a discount code might notice low engagement in certain regions. By adjusting the offer or targeting new areas, they can improve conversions.
The Power of Twitter Audience Analytics
By leveraging these insights, businesses can refine their approach, create high-performing content, and increase brand visibility. X analytics ensures every marketing effort is data-backed, leading to stronger business outcomes.
Final Thoughts
X analytics provides the insights you need to make smarter decisions and improve your social media strategy. Fine-tune your content, increase reach, and drive better results by tracking key metrics like engagement, impressions, and audience behavior. Whether you’re a creator, marketer, or business owner, using X analytics helps you understand what works and what needs improvement.
Start leveraging data-driven strategies and turn your analytics into actionable growth opportunities. The more you analyze, the better you optimize!
Frequently Asked Questions
Que: Is X Analytics still available?
X Analytics is now a premium feature that provides detailed insights into account performance. As of 2025, it is only accessible to paid subscribers.
Que: What is the Purpose of Analytics?
Analytics involves systematically examining data to identify patterns, predict outcomes, and support decision-making. It plays a vital role in various fields, including business, healthcare, and daily activities, helping users make informed and strategic choices.
Que: What Are The Types of Analytics & Their Functions?
Analytics falls into four main categories:
- Descriptive Analytics – Summarizes past data to explain what happened.
- Diagnostic Analytics – Analyzes historical data to identify reasons behind past events.
- Predictive Analytics – Uses past trends and statistical models to forecast future outcomes.
- Prescriptive Analytics – Suggests the best course of action based on predictive insights.

